- Microsoft Excel
- Regression Analysis
- Econometrics
- Residual Diagnostics
Analyzing the Airbnb Market: A Multivariate Pricing Strategy for Boston and DC Short-Term Rentals
What drives Airbnb prices in Boston and DC? A regression model built in Excel on 1,382 listings sets out to find out.
Executive Summary
Entire homes list for $73+ more per night than shared rooms, and Boston listings run about $18 above Washington, D.C. This Excel regression of 1,382 Airbnb listings shows how room type, city and guest capacity shape price.
Cleaned Sample
1,242
From 1,382 raw listings
Explained Variance
39.54%
Adjusted R² (F = 116.93, p < 0.001)
Entire Home Premium
+$73.17
Base premium vs. shared room (+$6.52 per guest)
Boston Premium
+$17.82
Per night vs. Washington, D.C.
Many hosts set prices by gut feel or a flat rule, which can backfire: price a big listing too high and it may sit empty, too low and money is left on the table. Built for an MBA course, this project starts with a one-variable regression and improves it step by step into a model that puts a dollar value on what drives price.
This project investigates three core questions:
- Room Type & City: How much more do entire homes and private rooms list for than shared rooms, and how much does Boston add over D.C.?
- Guest Capacity: How does price change as capacity grows, and does it change differently for entire homes?
- Model Fit: How much of the variation in price can a simple Excel regression explain, and what does it leave out?
Skills Demonstrated
- Data cleaning: Handled missing values, treated outliers with the IQR rule and encoded categorical variables.
- Statistical modeling: Built multiple regression models with quadratic and interaction terms and tested significance.
- Model diagnostics: Used residual plots and a correlation matrix to spot problems and improve each version.
- Business communication: Turned coefficients into plain-English pricing advice and a presentation deck.
Presentation Deck
A slide summary of the project, from the problem to the recommendations.
Step 1: Preparing the Data
- Cleaned the basics.
- Dropped ID columns that don’t help predict price (room_id, survey_id, host_id) and set nightly
price(USD) as the target. - Found 2 missing
bedroomsvalues and filled them with 1. Both were entire homes for 2 guests, so this was a safe call.
- Dropped ID columns that don’t help predict price (room_id, survey_id, host_id) and set nightly
- Dealt with outliers.
- Prices were heavily skewed by luxury listings (skewness of 3.77, mean of $194.25 vs. median of $129.50).
- I used the IQR rule (upper cutoff of $372.50) and removed 140 listings, about 10% of the data.
- The remaining 1,242 listings had a much more balanced distribution (skewness of 0.95), which suits regression.
- Encoded categories.
- Turned room type and city into 0/1 variables as
is_entireHome,is_privateRoom,is_boston. - The baseline for comparison is a shared room in Washington, D.C.
- Turned room type and city into 0/1 variables as
- Checked for overlapping variables.
bedroomsandaccommodateswere strongly correlated (r = 0.69), so they would blur each other’s effect.- I kept
accommodatesbecause it relates more closely to price (r = 0.49 vs. 0.40) and droppedbedrooms.
| Price Metric | Raw Data (N = 1,382) | Cleaned Data (N = 1,242) | What Changed |
|---|---|---|---|
| Mean price | $194.25 | $136.44 | Luxury outliers no longer pull the average up |
| Median price | $129.50 | $120.00 | The typical price barely moved |
| Standard deviation | $216.05 | $75.79 | 64.9% less volatility |
| Skewness | 3.770 | 0.947 | Much closer to a normal shape |
Step 2: Building the Model in Three Rounds
Round 1: Simple Linear Regression
- Predicted
priceusing only guest capacity (accommodates). - Result: about +$19.96 per extra guest on top of a $73.94 starting point. It was statistically significant but explained only 24.18% of price variation.
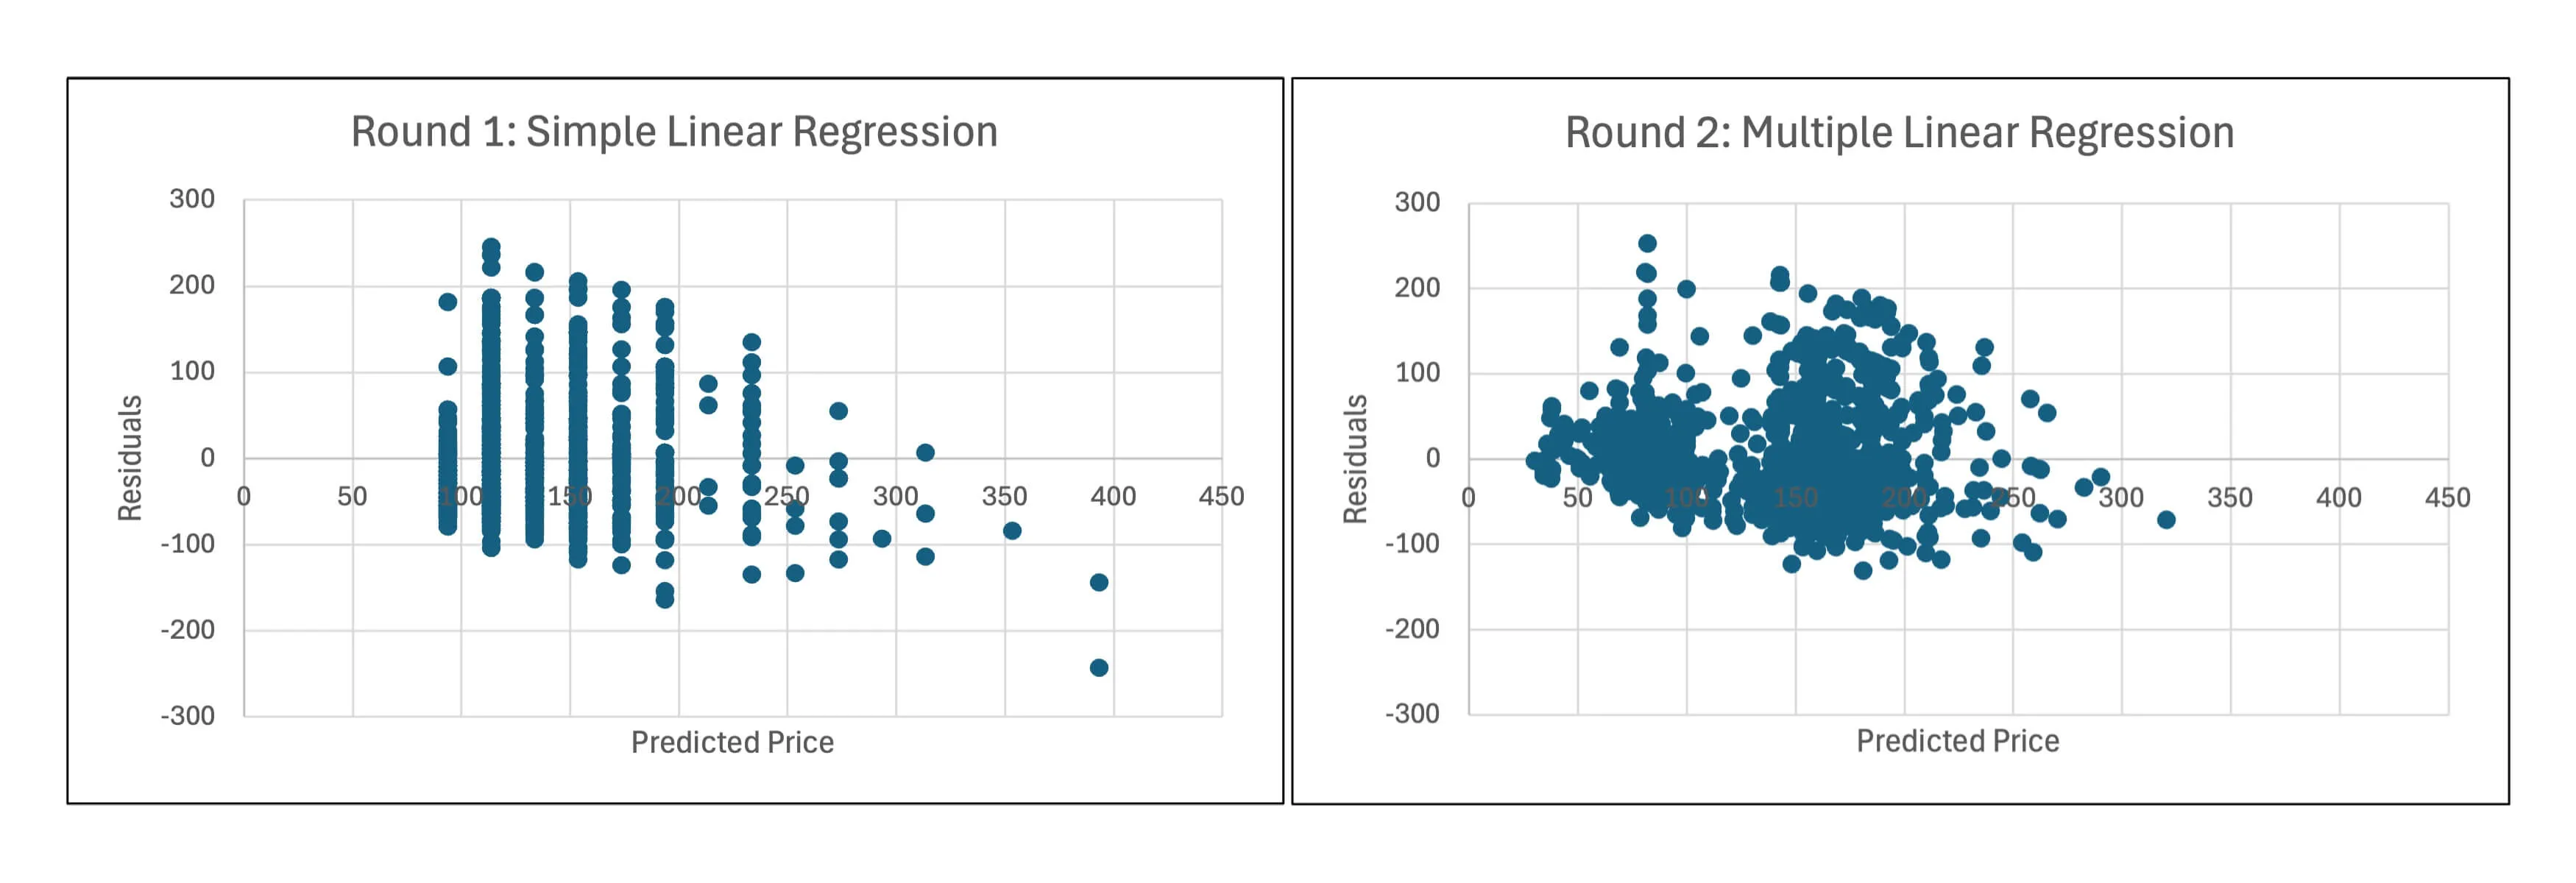
- What the residuals showed: the residual plot formed vertical stripes instead of random scatter. That told me important categories, like room type, were missing from the model.
Round 2: Multiple Linear Regression
- Added room type, city, review count (
reviews) andoverall_satisfaction. overall_satisfactionwas not statistically significant (p = 0.78), so I removed it.- Result: Adjusted R² rose to 39.10% and the stripes disappeared. The model still over-predicted prices for larger groups.
Round 3: Non-linear model (final)
- Added two terms to fix the large-group problem:
accommodates_squared, so the model can show price gains slowing as groups get bigger.accommodates × is_entireHome, because an extra guest is worth more in an entire home than in a room.
- All seven predictors are significant (p < 0.05). Adjusted R² reached 39.54% and the standard error fell to $58.93.
| Model | R² | Adjusted R² | Std. Error | Key Takeaway |
|---|---|---|---|---|
| 1. Simple linear | 24.18% | 24.12% | $66.02 | Striped residuals: missing variables |
| 2a. Multiple linear (full) | 39.35% | 39.05% | $59.17 | overall_satisfaction not significant |
| 2b. Multiple linear (pruned) | 39.35% | 39.10% | $59.15 | Stripes gone, but large groups over-predicted |
| 4. Non-linear (final) | 39.88% | 39.54% | $58.93 | Captures slowing gains and the entire-home effect |
The Final Model
Predicted Price = 26.91 + 73.17(EntireHome) + 30.94(PrivateRoom) + 17.82(Boston)
                  - 0.17(Reviews) + 13.56(Accommodates) - 0.59(Accommodates²)
                  + 6.52(Accommodates × EntireHome)
The baseline is a shared room in Washington, D.C.
| Variable | Coefficient | Std. Error | t-Stat | P-Value | 95% Confidence Interval |
|---|---|---|---|---|---|
| Intercept (shared room, D.C.) | 26.91 | 12.61 | 2.13 | 0.0331 | [$2.16, $51.66] |
| is_entireHome | +73.17 | 13.37 | 5.47 | < 0.0001 | [$46.94, $99.40] |
| is_privateRoom | +30.94 | 11.72 | 2.64 | 0.0084 | [$7.93, $53.94] |
| is_boston | +17.82 | 3.44 | 5.18 | < 0.0001 | [$11.08, $24.57] |
| reviews | -0.17 | 0.04 | -3.85 | 0.0001 | [-$0.26, -$0.08] |
| accommodates | +13.56 | 3.36 | 4.04 | < 0.0001 | [$6.97, $20.15] |
| accommodates_squared | -0.59 | 0.24 | -2.49 | 0.0128 | [-$1.05, -$0.13] |
| interaction_accom_entireHome | +6.52 | 2.70 | 2.41 | 0.0160 | [$1.22, $11.82] |
What the numbers mean
- Room type matters most. A private room adds $30.94 per night over a shared room. An entire home adds $73.17, which is $42.23 more than a private room, before counting guest capacity.
- Boston costs more. With room type, capacity and reviews held equal, Boston listings average $17.82 more per night than D.C.
- More reviews, slightly lower price. Each extra review goes with a $0.17 lower price, so 100 reviews is about $17 lower. This likely reflects budget listings that book often, not reviews hurting a listing’s value.
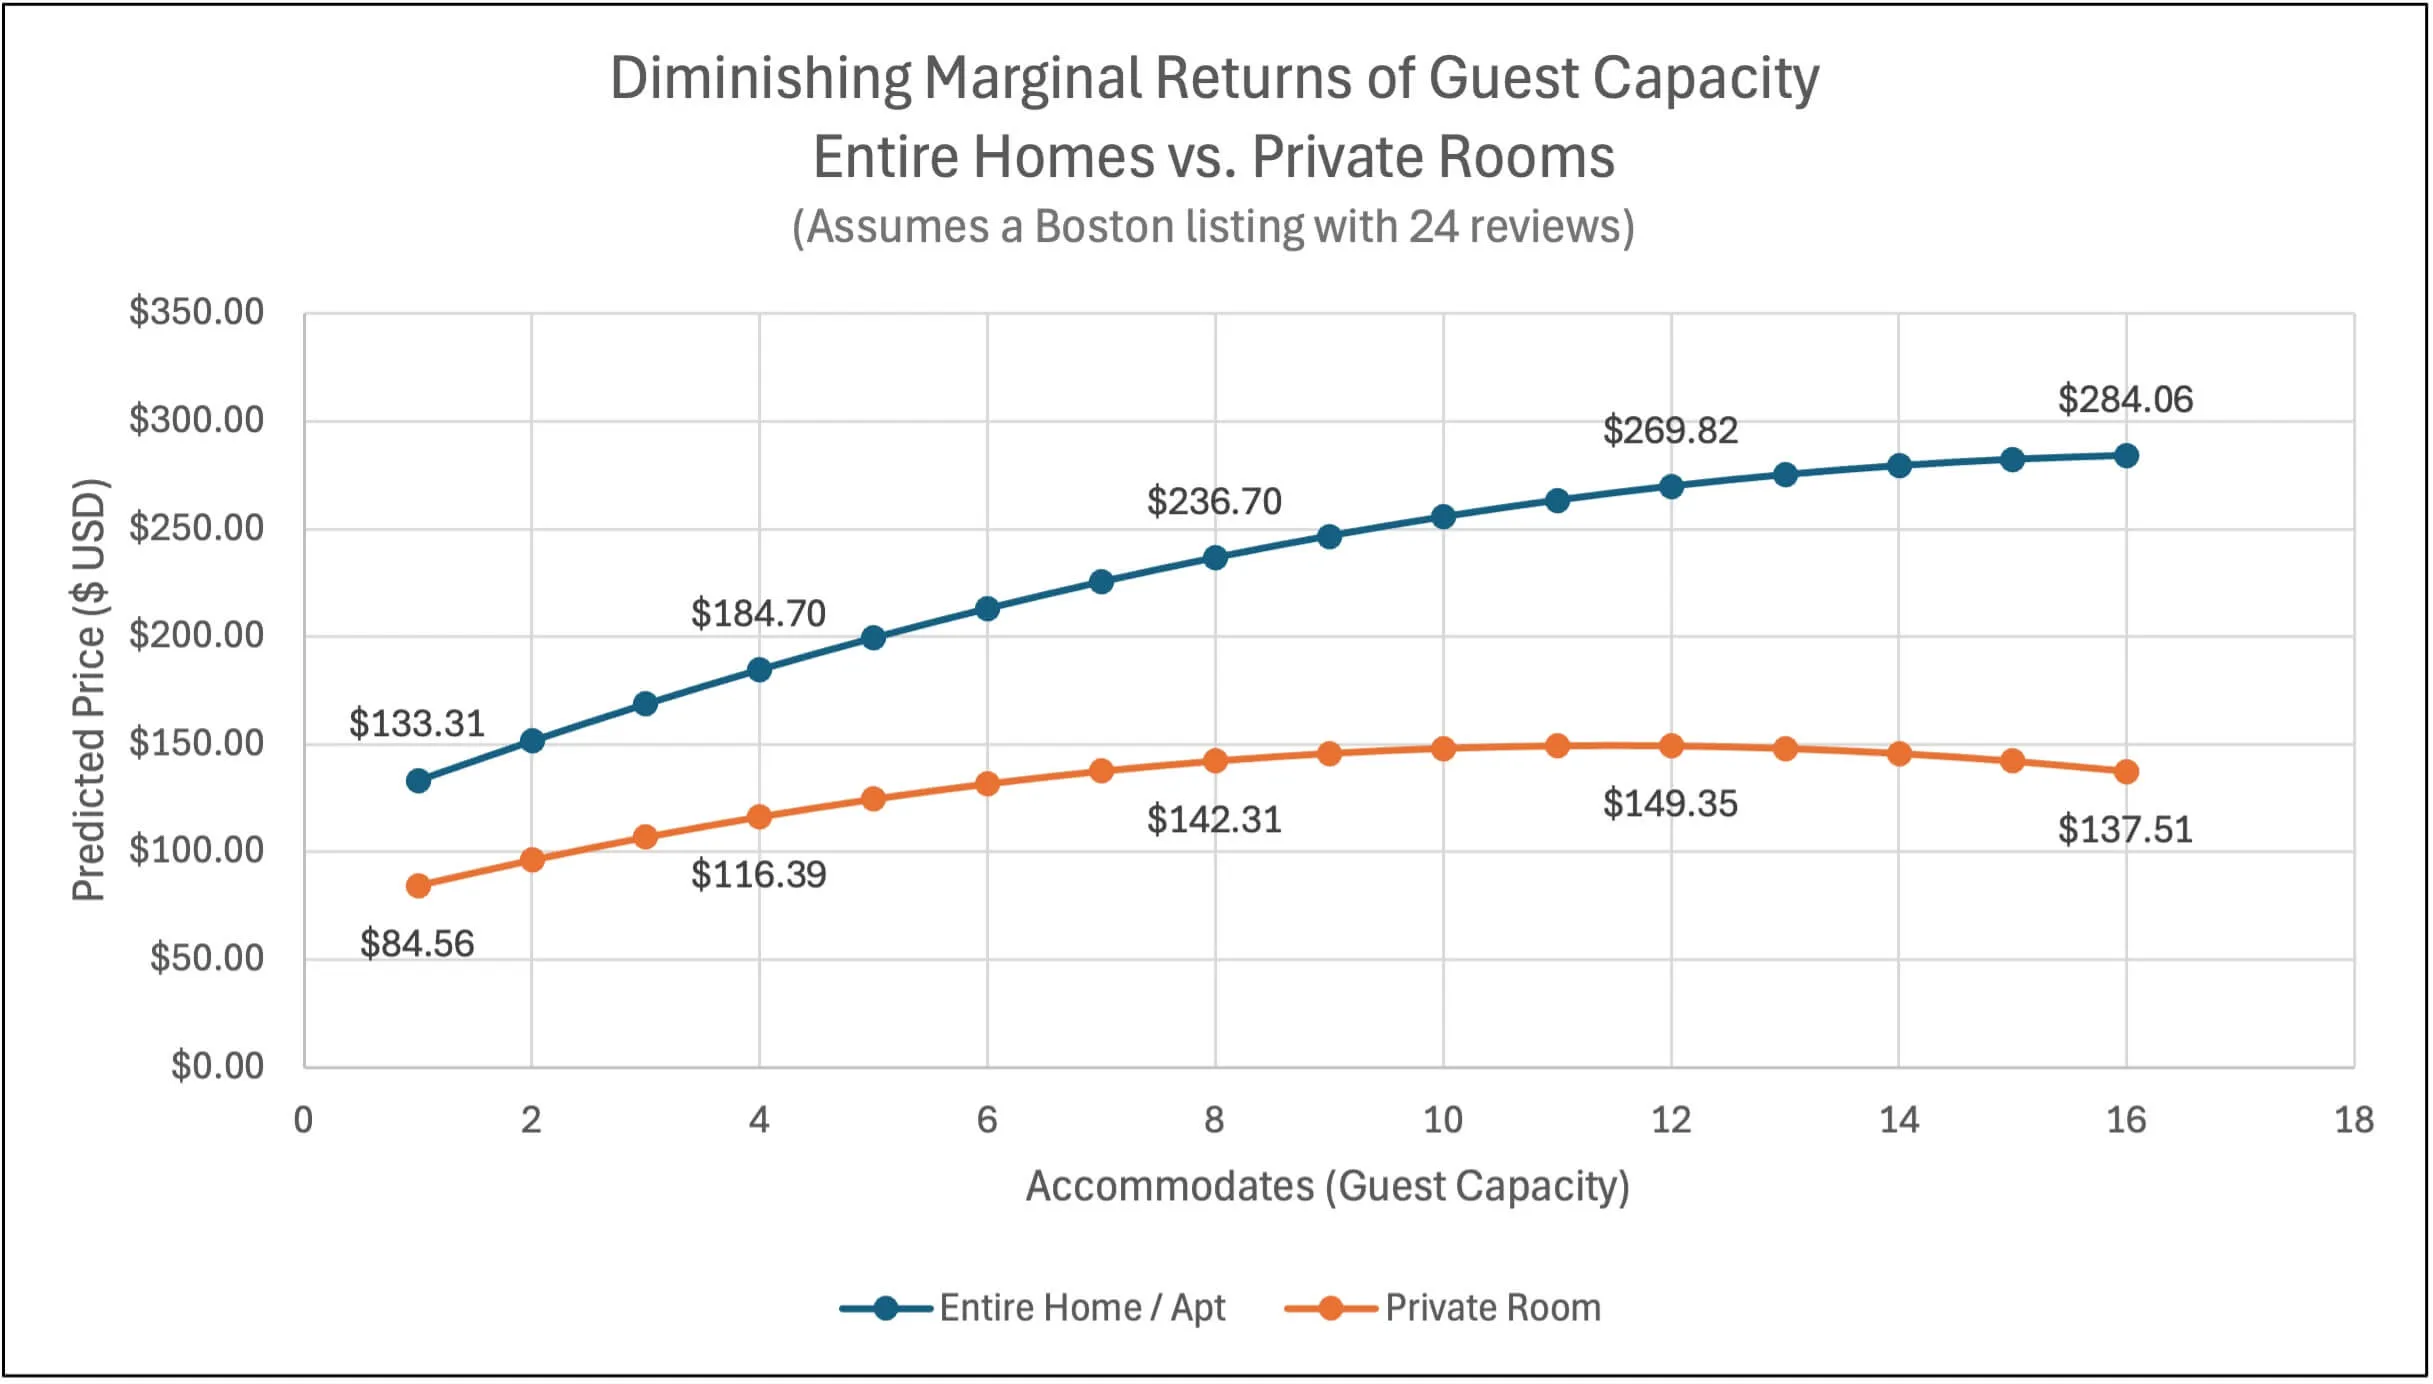
- Extra guests add less each time. Guest capacity has a curved effect, not a straight line.
- For private and shared rooms, the gain per guest shrinks steadily and levels off at around 11 to 12 guests.
- For entire homes, the interaction term lifts the starting gain to +$20.08 per guest (13.56 + 6.52).
- Example: a Boston entire home with 24 reviews is predicted at $133.31 for 1 guest, $184.70 for 4 guests and $236.70 for 8 guests.
Business Recommendations
- Look closely at entire homes for 4 to 8 guests. An entire home lists for about $73 more per night than a shared room at baseline, and the gap grows by about $6.50 for each extra guest (roughly $86 at 2 guests).
- Build the Boston premium into pricing. Anyone comparing the two cities should expect about $17.82 more per night in Boston and factor that in when setting rates or evaluating a property.
- Use tiered pricing instead of a flat extra-guest fee. The model shows each added guest is worth a bit less than the one before, by roughly $1.18. A flat fee likely overcharges larger groups, so a fee that tapers down as the group grows is a better fit.
Bottom Line
Room type and city explain most of what hosts can predict about price. Entire homes carry a premium that widens with group size and Boston runs about $18 above D.C. The model is a useful pricing benchmark, but it can’t show profit or demand, which the data doesn’t include.
Limitations
- It predicts price, not profit. The data has no occupancy, booking, or cost information. The model shows where prices run higher, not which listings earn the most.
- Important details are missing. Amenities like parking, renovation quality and distance to transit or landmarks are not in the data. They likely account for much of the 60% of variation the model does not explain.
- City-level view only. The model treats every Boston neighborhood the same and every D.C. neighborhood the same. A next version could add neighborhood or zip-code effects and model
ln(Price)to better handle expensive listings. - One snapshot in time. The data can’t show seasonality, local events, or weekday vs. weekend demand.
Data Source & Attribution
Airbnb listing data for Boston and Washington, D.C., based on the open-source Airbnb Data Collection by Tom Slee, which gathers public listings from the Airbnb website. I received the 1,382-listing sample (534 in Boston, 848 in D.C.) through my MBA course, MIS 657: Business Analytics. Prices are nightly rates in US dollars. This project was done for academic purposes only.
- Microsoft Excel
- Regression Analysis
- Econometrics
- Residual Diagnostics