- Python
- Pandas
- NumPy
- Matplotlib
Bangladesh Pharmaceutical Market Analysis: Concentration, Pricing Power & Market Gaps
Who dominates Bangladesh’s pharma market and where is there room to compete? A Python analysis of 21,712 medicine brands and 232 manufacturers.
Executive Summary
Just 50 of 232 manufacturers hold 74.2% of Bangladesh’s 21,712 registered medicine brands. This Python analysis maps where the market is crowded, where it is underserved and how competition shapes prices.
Active Brands
21,712
Across 232 manufacturers
Registered Generics
1,711
1,661 active & 50 unmanufactured
Core Price Spread
1.09x
Median IQR across 347 cohorts
Monopoly Premium
5.2x
৳77.76 vs ৳15.00 in crowded tiers
This project investigates three core strategic questions:
- Portfolio Concentration & Entry Barriers: How concentrated is the pharmaceutical product catalog among top-tier manufacturers versus smaller producers? Do top manufacturers dominate complex dosage forms?
- Price Dispersion: Controlling for identical generic, dosage form and strength, how much price dispersion exists across competing brands? Do top-tier manufacturers consistently charge a brand premium?
- Market Gaps: Which clinical indications and drug classes are hyper-saturated (high brand-to-generic saturation ratio) versus underserved (low brand competition / unmanufactured generic gaps)?
Key Strategic Findings
1. Portfolio Concentration & Entry Barriers
- Top-Heavy Market Structure: The Top 50 manufacturers (21.5% of firms) control 74.2% of all registered brands in Bangladesh, while the remaining 182 small/niche producers split the remaining 25.8%.
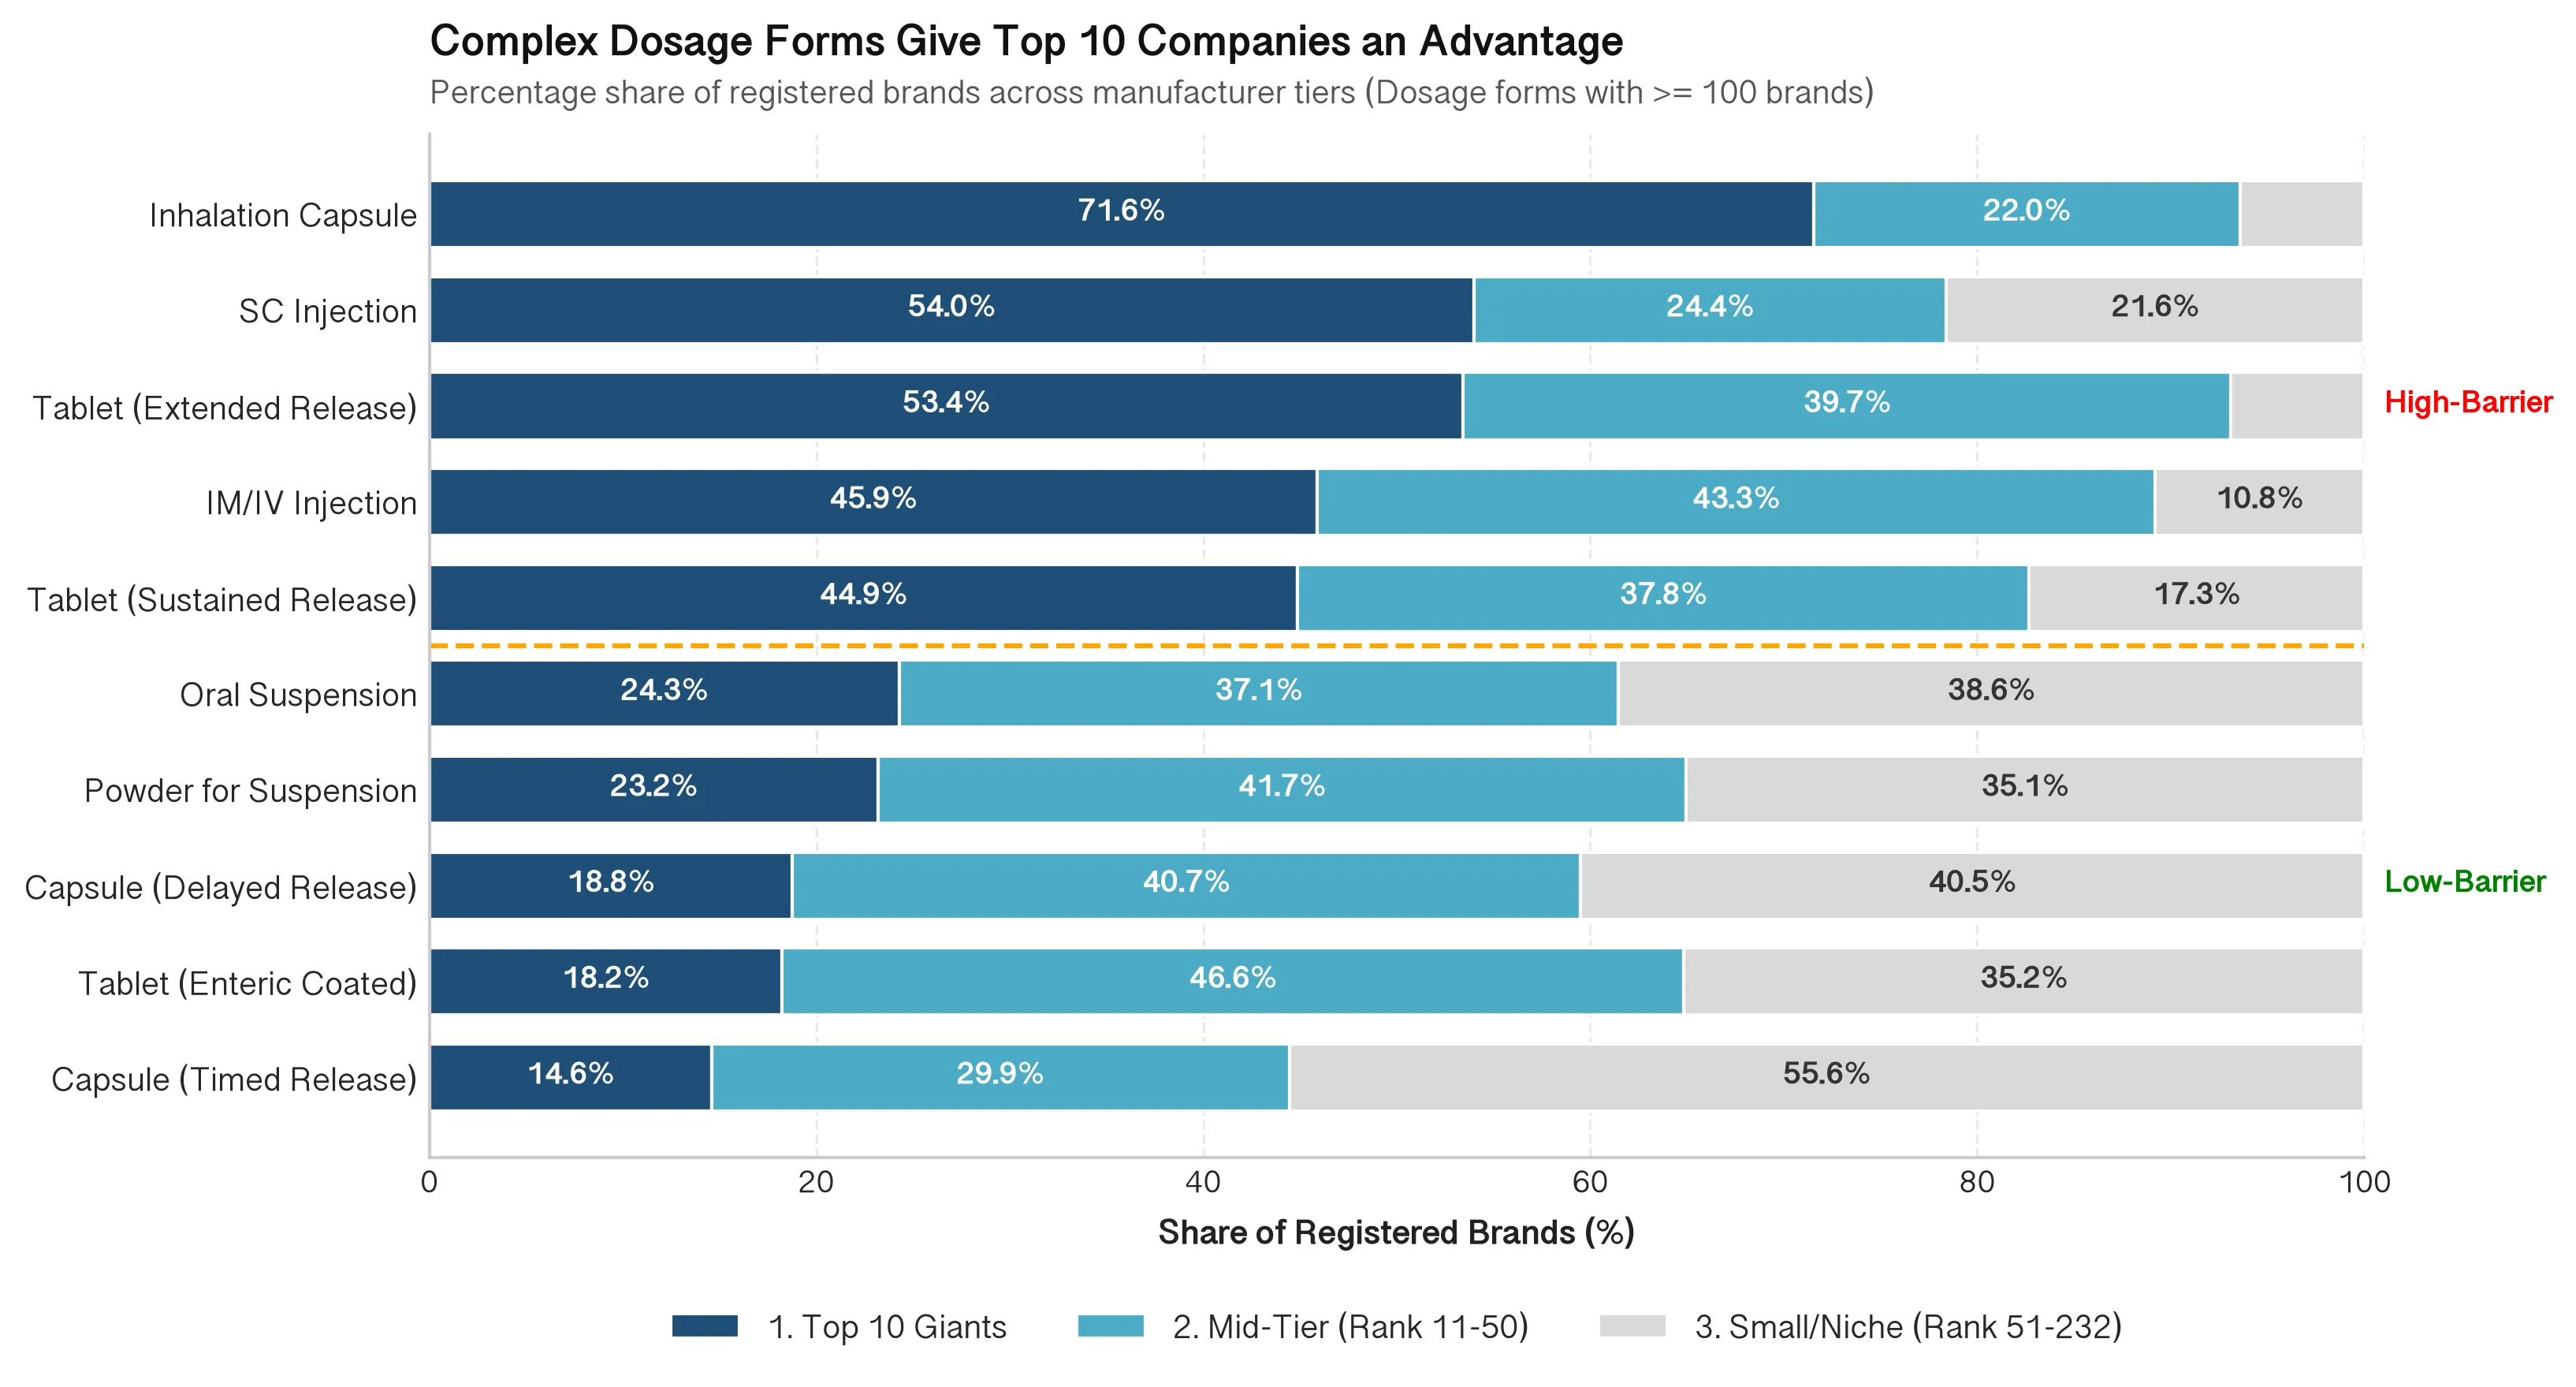
- Dosage Form Complexity: By dosage form, Top 10 giants dominate in Inhalation Capsules (71.6% share), Extended-Release Tablets (53.4%) and IM/IV Injections (45.9%), where small companies hold less than 11% share. Conversely, small companies crowd into lower-barrier liquids (Syrups 34.7%, Oral Suspensions 38.6%) and Delayed/Timed-Release Capsules (40.5%–55.6%).
- Low-Barrier Crowding: Small/Niche manufacturers (Rank 51–232) are largely locked out of complex injectables and inhalers. They cluster heavily in standard oral solids and pre-formulated pellets such as Timed-Release Capsules (55.6%), Delayed-Release Capsules (40.5%) and Oral Suspensions (38.6%).
2. Price Dispersion Analysis
- Tight Core Market Compression: Across 347 comparable unit-dose drug cohorts (≥10 competing brands), the middle 50% of the market (
Q75 / Q25interquartile ratio) exhibits a median spread of just 1.09x (only a 9% price difference). This likely reflects strong price anchoring around Directorate General of Drug Administration (DGDA) Maximum Retail Price (MRP) ceilings. - Extreme Tail Outliers: The median max-to-min price ratio is 1.76x, with extreme outliers reaching 13.9x to 21.3x (e.g., Diclofenac Sodium 50 mg, Rivastigmine 1.5 mg, Letrozole 2.5 mg) likely driven by imported multinational originator brands competing against low-cost domestic generics.
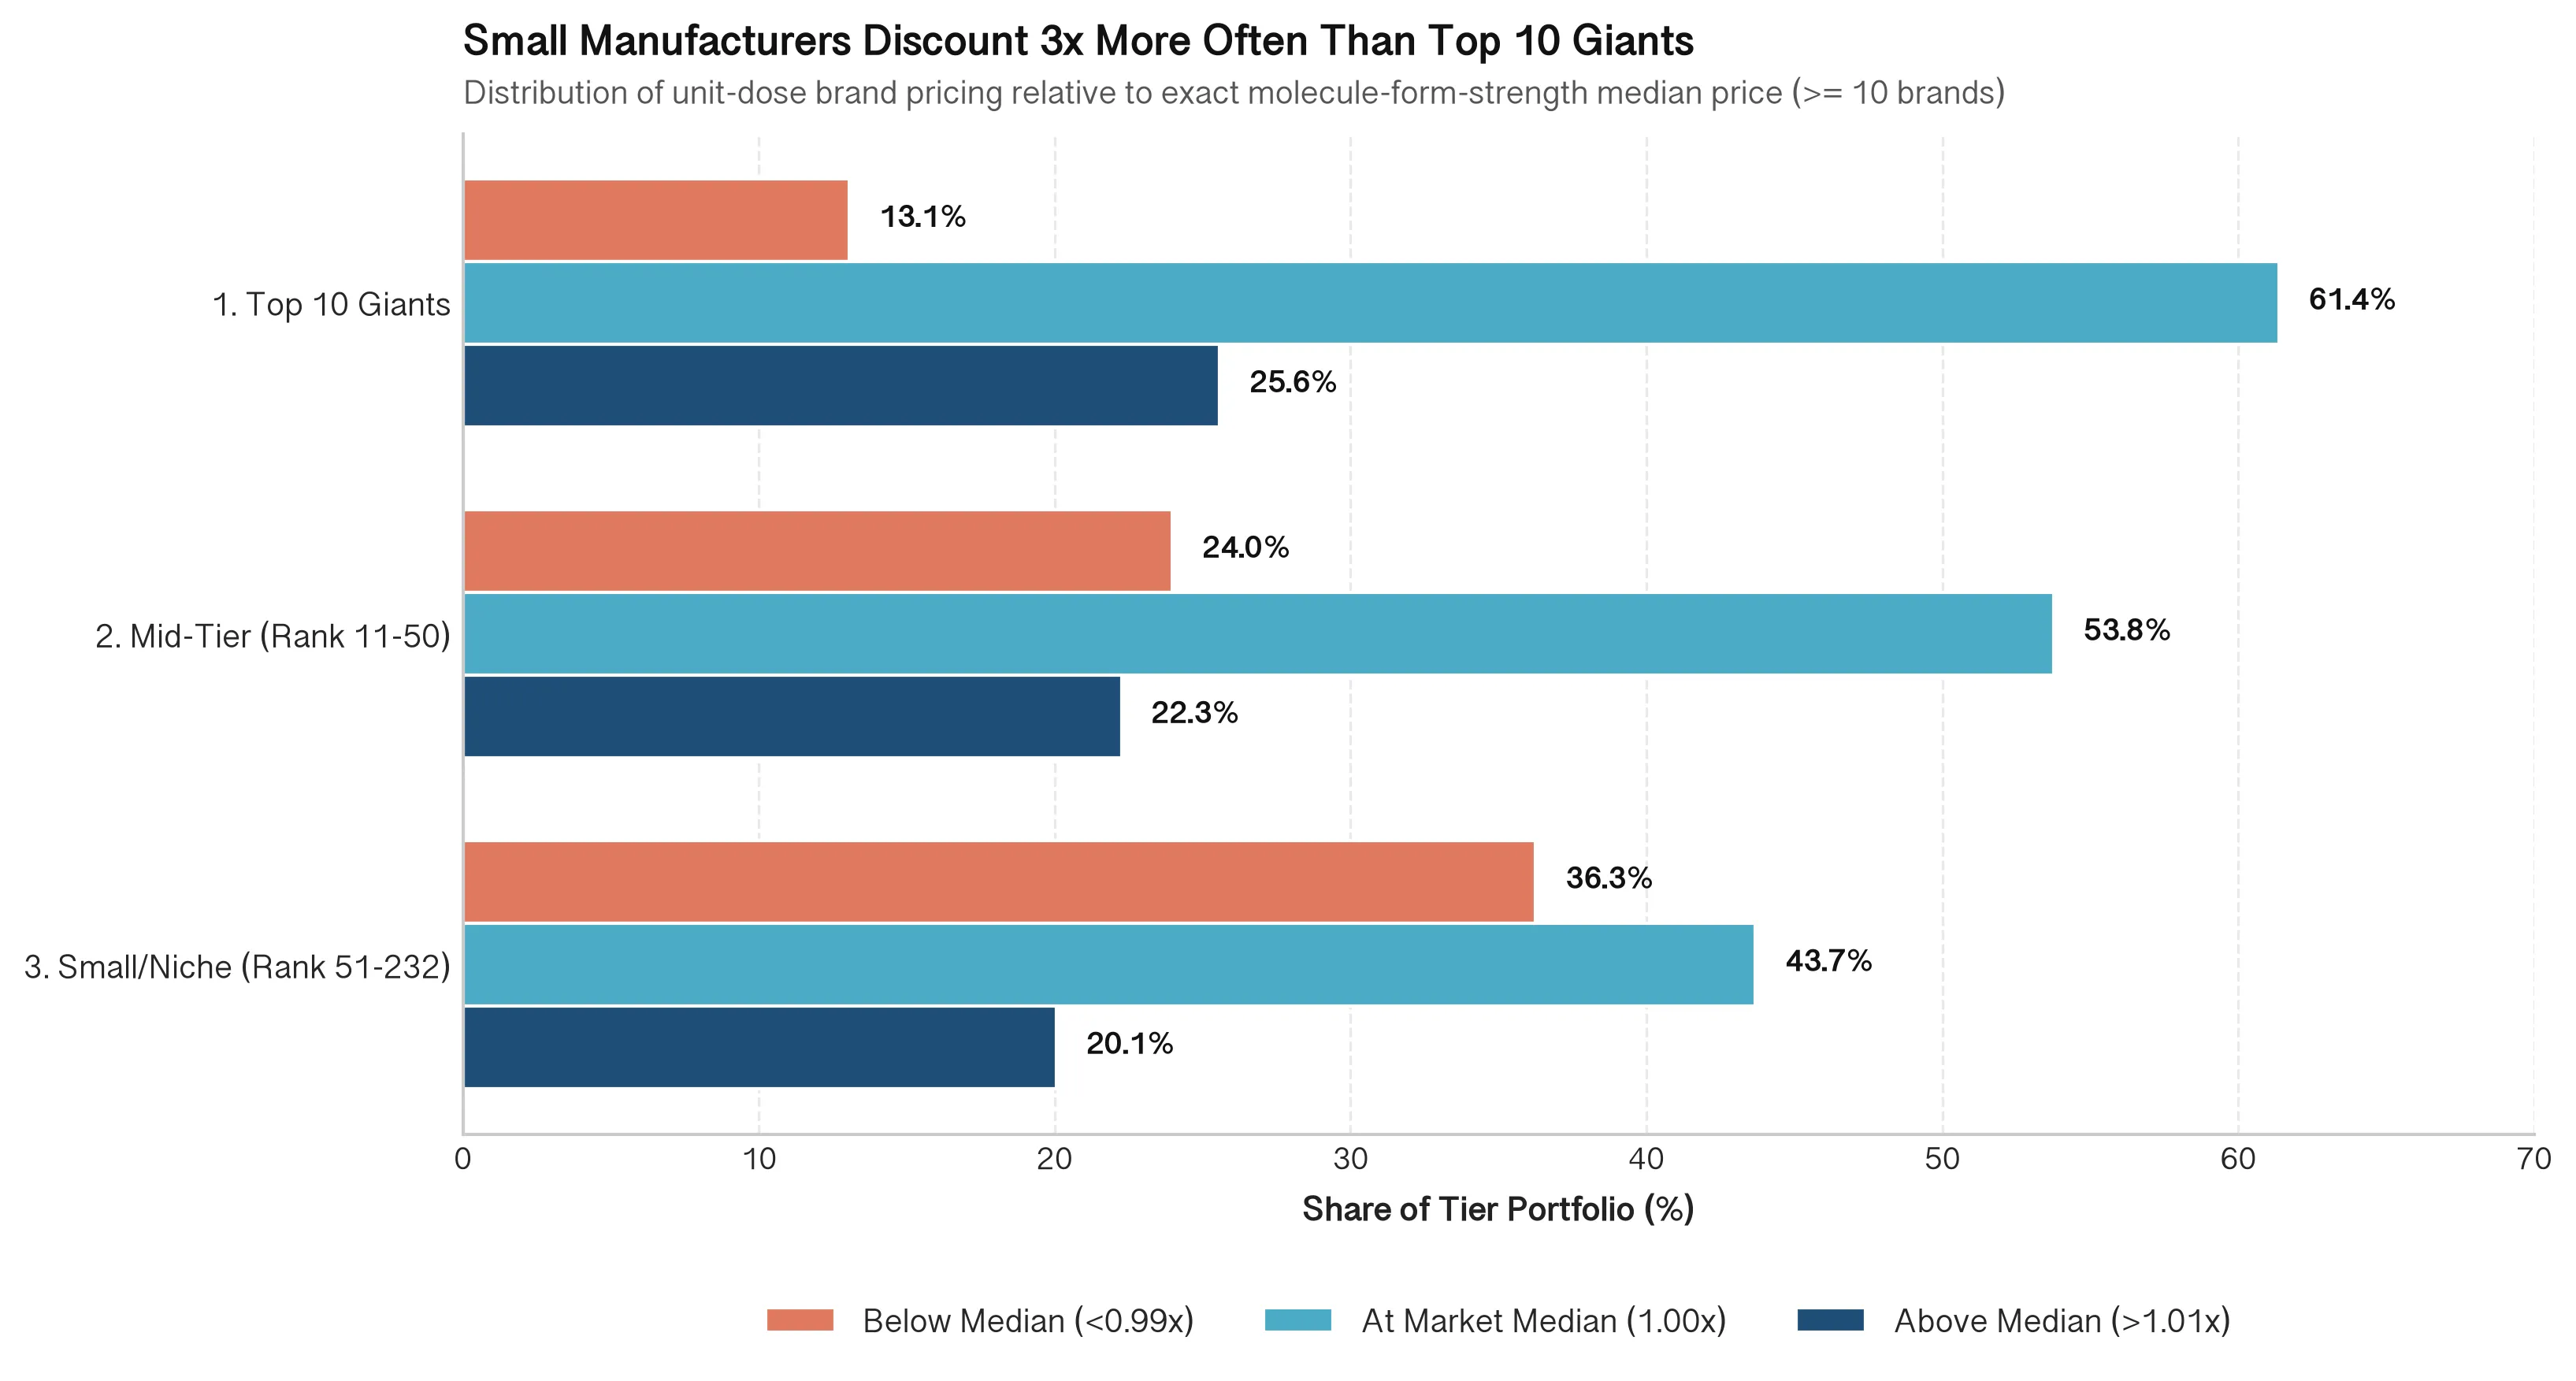
- Tier Pricing Behavior: Top 10 Giants act as the market’s price anchor. 86.9% of their unit-dose products are priced At (61.4%) or Above (25.6%) the cohort median, while discounting only 13.1% of their brands. Conversely, Small/Niche manufacturers price 36.3% of their products below the market median, nearly 3x the discounting rate of Top 10 giants.
| Manufacturer Tier | Above Median (>1.01x Premium) |
At Market Median (1.00x) |
Below Median (<0.99x Discount) |
|---|---|---|---|
| 1. Top 10 Giants | 25.6% | 61.4% | 13.1% |
| 2. Mid-Tier (Rank 11–50) | 22.3% | 53.8% | 24.0% |
| 3. Small/Niche (Rank 51–232) | 20.1% | 43.7% | 36.3% |
3. Market Gaps Analysis
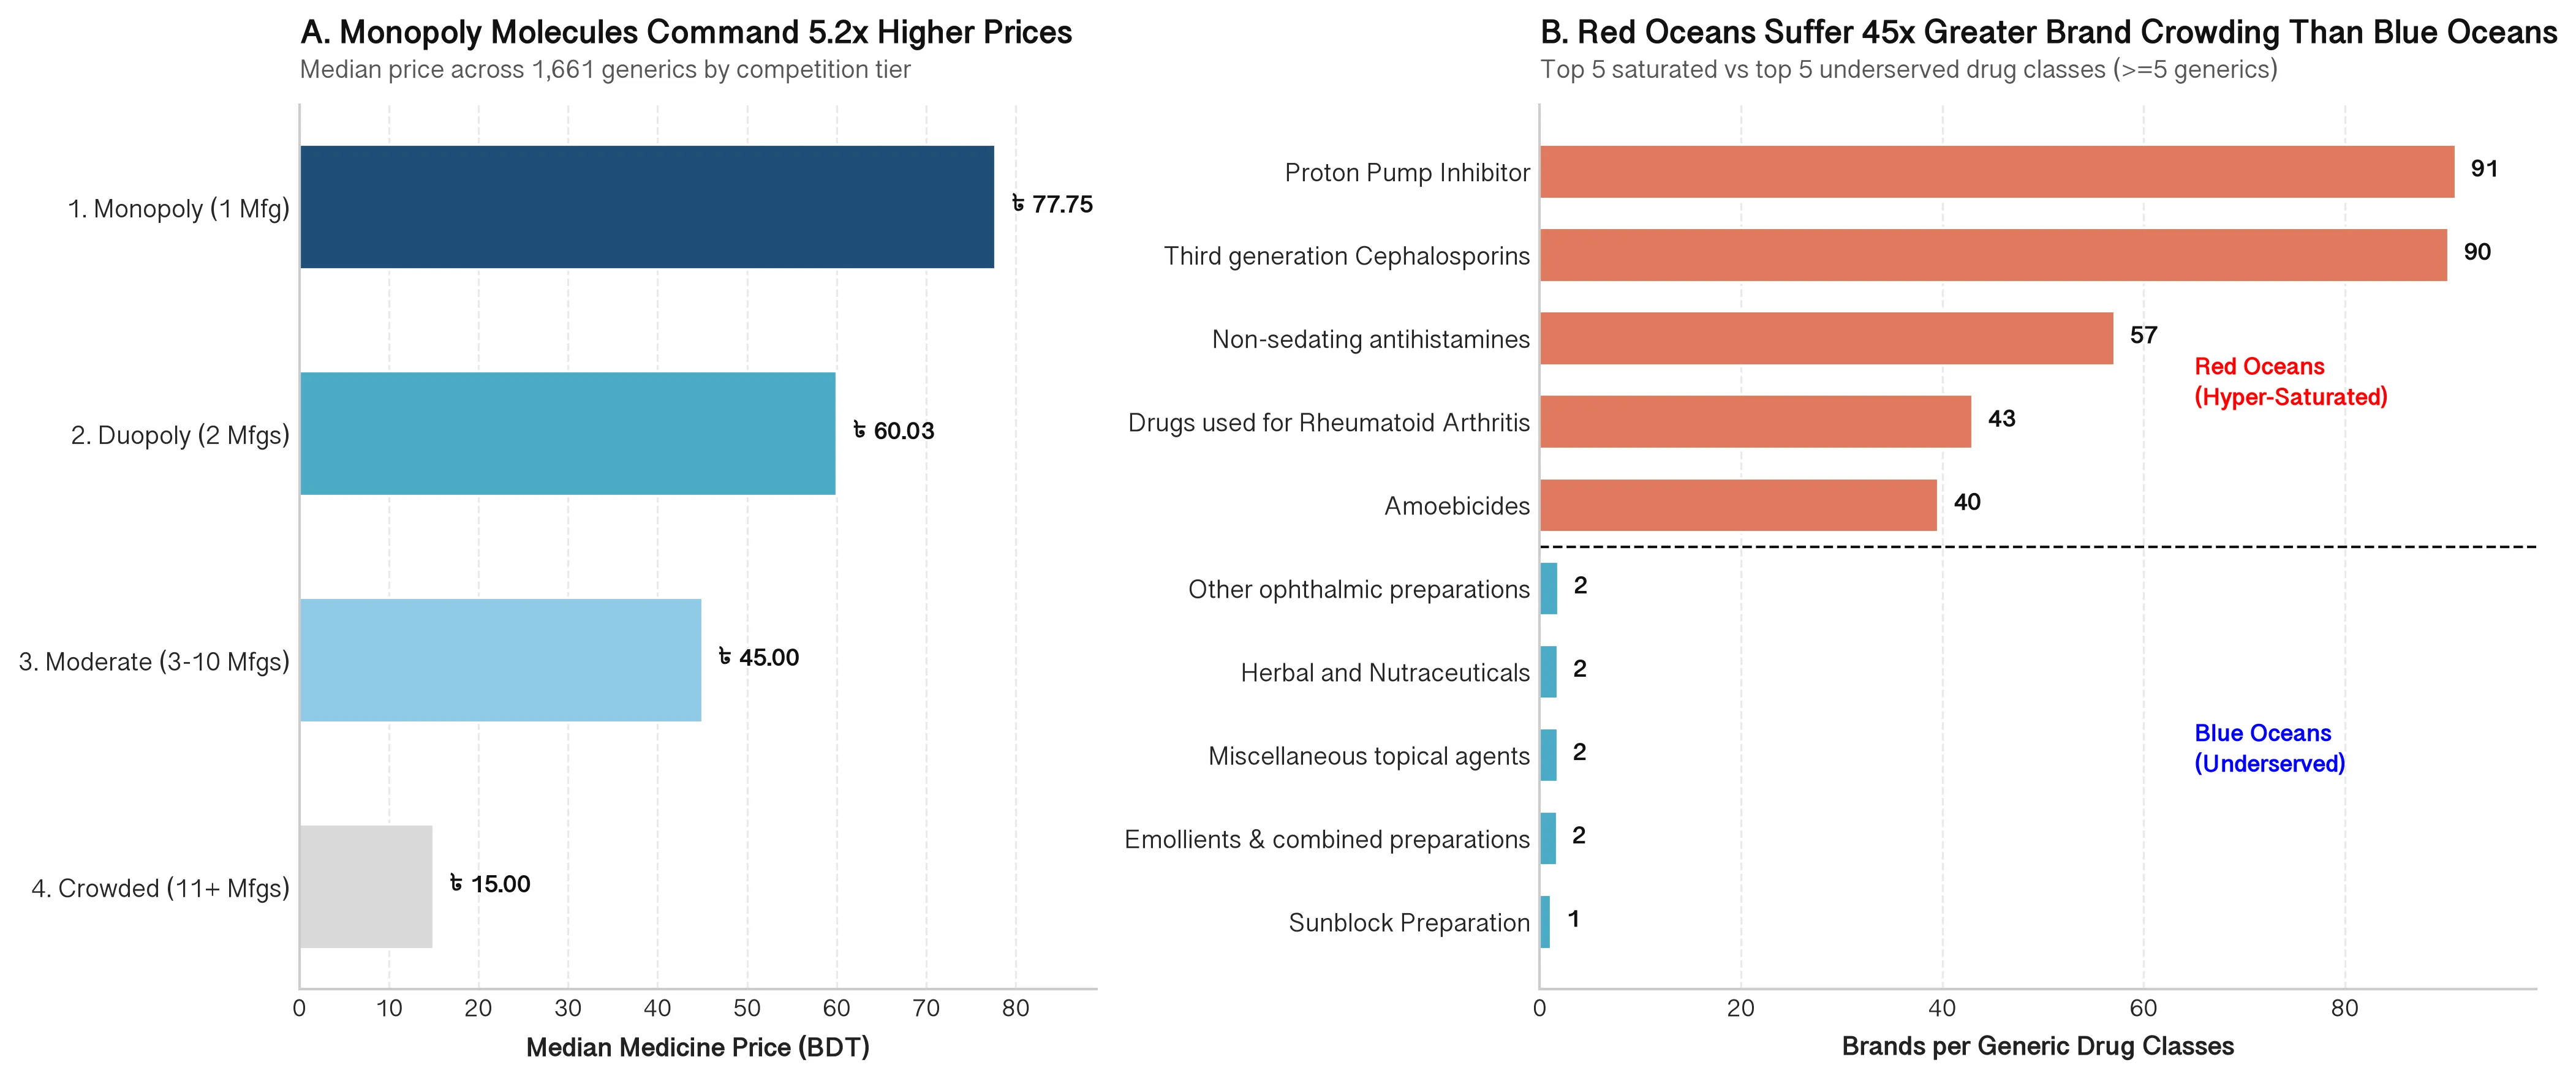
- Hyper-Saturated (Red Oceans): Just 18.48% of active generics (307 crowded generics) absorb 74.0% of registered brands (16,069 brands). Among established drug classes (≥5 generics), competition is highest in Proton Pump Inhibitors (91.0 brands/generic) and Third-Generation Cephalosporins (90.3), followed by Non-sedating Antihistamines (57.1) and Rheumatoid Arthritis drugs (43.0).
- Low-Competition Markets (Blue Oceans): Nearly half of all active generics (44.6% or 741 generics) are supplied by only one or two manufacturers: 542 monopolies (32.63%) and 199 duopolies (11.98%). Lower brand density is observed in Sunblock Preparations (1.14 brands/generic), Other Ophthalmics (1.88), Vaccines, Anti-sera & Immunoglobulins (2.00), Oral Contraceptives (2.36) and Non-depolarizing Muscle Relaxants (2.40).
- The Pricing Power Staircase: Molecule-level competition directly governs unit economics. Median drug prices climb 5.2x from ৳15.00 in Crowded generics (11+ mfgs) up to ৳60.04 in Duopolies and ৳77.76 in Monopolies.
- Unmanufactured Generics (White Space): Among the 50 unmanufactured generics (0 brands), infectious diseases (HIV, TB, Malaria) reflect public/NGO distribution. However, Antidotes (3), Antiparkinson (2) and Contrast Medium (2) represent viable commercial opportunities.
| Molecule Competition Tier | Active Generics | Share of Generics (%) | Total Registered Brands | Share of Brands (%) | Median Drug Price (BDT) |
|---|---|---|---|---|---|
| 1. Monopoly (1 Mfg) | 542 | 32.63% | 655 | 3.02% | ৳ 77.76 |
| 2. Duopoly (2 Mfgs) | 199 | 11.98% | 498 | 2.29% | ৳ 60.04 |
| 3. Moderate (3–10 Mfgs) | 613 | 36.91% | 4,490 | 20.68% | ৳ 45.00 |
| 4. Crowded (11+ Mfgs) | 307 | 18.48% | 16,069 | 74.01% | ৳ 15.00 |
Business Recommendations
- Avoid launching similar products in highly competitive generic markets: Manufacturers across the industry should pause new product launches in hyper-saturated drugs such as Proton Pump Inhibitors (91.0 brands/generic), 3rd-Gen Cephalosporins (90.3) and Non-sedating Antihistamines (57.1). These markets already have 85–128 competing manufacturers, with median prices as low as ৳15.00, limiting profit potential.
- Target Fast-Follower Entry into Monopoly & Duopoly Markets: Established manufacturers should redirect R&D and product development budgets toward the 542 Monopoly and 199 Duopoly generic products. With median prices of ৳60–78, these products offer 4–5 times higher median price per unit and face less pressure from price competition.
- Invest in specialized products that are harder to manufacture: Mid-Tier manufacturers aiming to grow should invest in sterile injectables, inhalation products, and products requiring strict manufacturing controls. Priority areas include Vaccines/Biologics (2.00 brands/generic), Oral Contraceptives (2.36) and Surgical Muscle Relaxants (2.40). Companies should also explore hospital product categories with no current domestic manufacturers, such as Diagnostic Contrast Media and Antidotes, where competition may be limited.
- Build Niche Markets Without Competing on Price (Small Manufacturers and New Entrants): Small manufacturers (Rank 51–232) price 36.3% of their products below the market median to increase market access, reducing profit margins in already crowded generic markets. Small manufacturers often cannot afford facilities for sterile injectables or biologics. Instead, they should focus on low-cost, less competitive products such as sunblock preparations (1.14 brands/generic), emollients (1.71), miscellaneous topicals (1.78), and herbal/nutraceutical products (1.81). These categories can use standard manufacturing facilities and offer opportunities to enter markets with relatively few competing domestic brands.
- Commercialize Viable Unmanufactured Generics: Among the 50 registered generics with no active brands, companies should distinguish products with limited commercial potential from those that offer real business opportunities. Public/NGO-distributed infectious disease generics (HIV, TB, Malaria) may not be commercially viable for domestic manufacturers. However, Antidotes (3), Antiparkinson (2) and Contrast Medium (2) represent potential gaps for market entry.
Bottom Line
Bangladesh’s pharma market is crowded where entry is easy and concentrated where it is hard. Just 18.5% of generics hold 74% of all registered brands and sell at a median of ৳15, while monopoly generics, about a third of all active generics, sell at a median of ৳77.76. For manufacturers, the opportunity is in less-crowded and harder-to-make products, not in another brand of an already saturated drug.
Limitations & Next Steps
Limitations
- Brand counts, not sales: “Market share” here means share of registered brands. Without sales or volume data, it can’t show revenue share.
- Listed prices, not profits: Prices are listed MRPs and there is no cost data. So a higher price doesn’t necessarily mean a higher margin.
- Association, not causation: Monopoly generics may be priced higher because they are niche, complex or imported, not only because they lack competition.
- Single snapshot and source: The data is one extract from Medex and
per_containerprices were excluded. So the price analysis covers per-unit products only.
Next Steps
- Add sales or volume data, if available, to turn brand share into revenue share.
- Track prices over time to see how MRPs move as competition changes.
- Run a regression of price on competition tier, controlling for dosage form and drug class, to test the monopoly premium more rigorously.
Data & Methodology
Source: Assorted Medicine Dataset of Bangladesh on Kaggle, which compiles public pharmaceutical registry data from Medex.com.bd (aligned with DGDA registrations). It has six relational tables covering 21,712 brands, 1,711 generics, 232 manufacturers and 358 drug classes. Prices are listed MRPs in BDT at the time of extraction.
Process:
- Cleaning: Standardized registry records, parsed pricing strings into numeric values and separated per-unit from per-container prices to avoid container-size distortion. Set aside 50 generics with no active brands for the white-space analysis.
- Analysis: Grouped manufacturers into three tiers (Top 10, Rank 11–50, Rank 51–232). Compared prices within unit-dose cohorts (same generic, dosage form and strength, with 10+ brands) using IQR and max-to-min ratios, and classified generics by number of manufacturers, from monopoly to crowded. Per-container prices were excluded as inconsistent.
- Visualization: Built the charts in matplotlib and seaborn and prepared the enriched dataset for the interactive dashboard.
For educational and portfolio purposes only, not medical advice.
Source code: All datasets and notebooks are in the GitHub Repository.
- Python
- Pandas
- NumPy
- Matplotlib